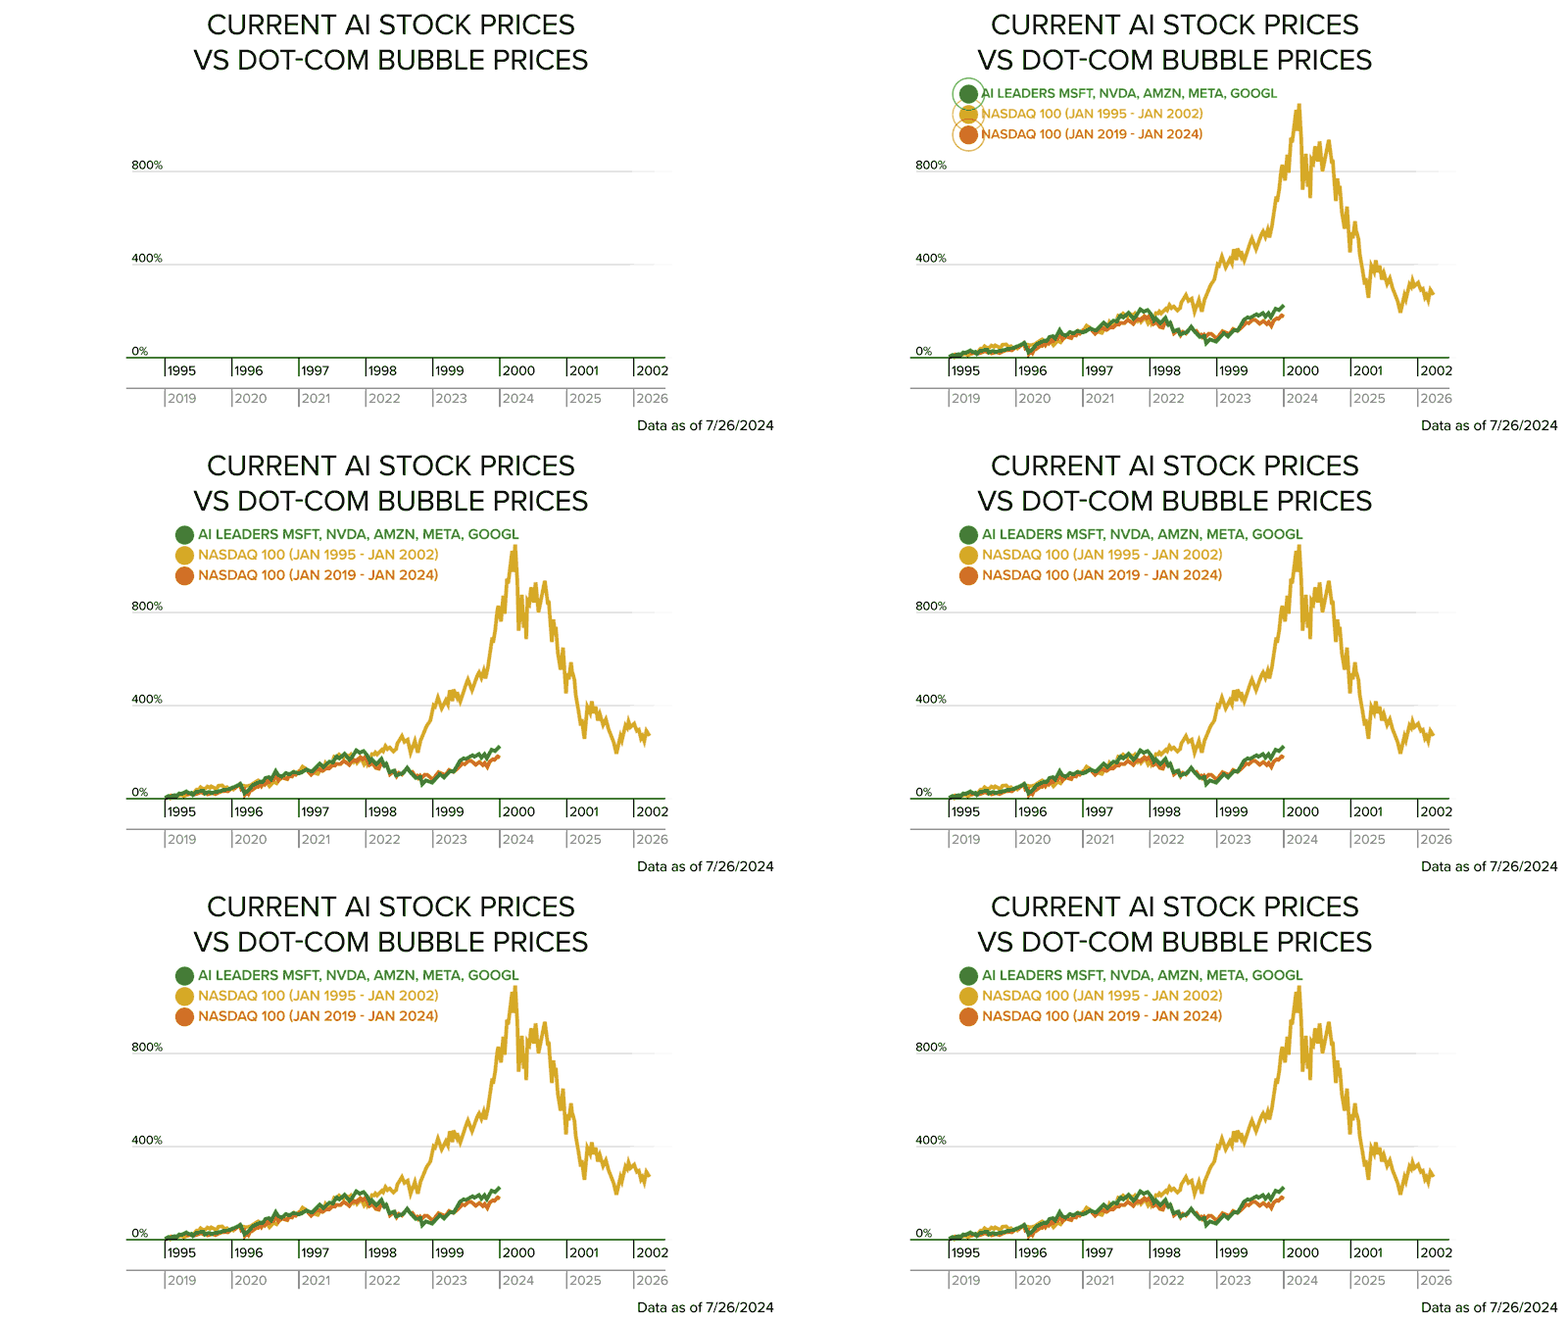
Automated Chart System: Workflow Innovation in After Effects
Overview
Client / Team: The Motley Fool (internal design & marketing teams)
Role: Creative Director / Workflow Architect
Deliverables: Automated chart templates for video, web graphics, and email
The Challenge
As a regulated financial publisher, every chart needed to be accurate to the cent, consistently branded, and adaptableacross platforms (video, web, email). Our existing workflow was slow, inconsistent, and relied heavily on static third-party assets.
Flat charts limited storytelling potential.
Third-party sourcing created licensing issues and inconsistent branding.
Manual workflows allowed only 1 animated chart per campaign, creating bottlenecks as demand grew.
Creative Strategy
Dynamic Templates: Intuitive, repeatable designs built in After Effects.
Standardized Branding: Unified line styles, colors, and typography.
Scalable System: One adaptable template for multiple formats.
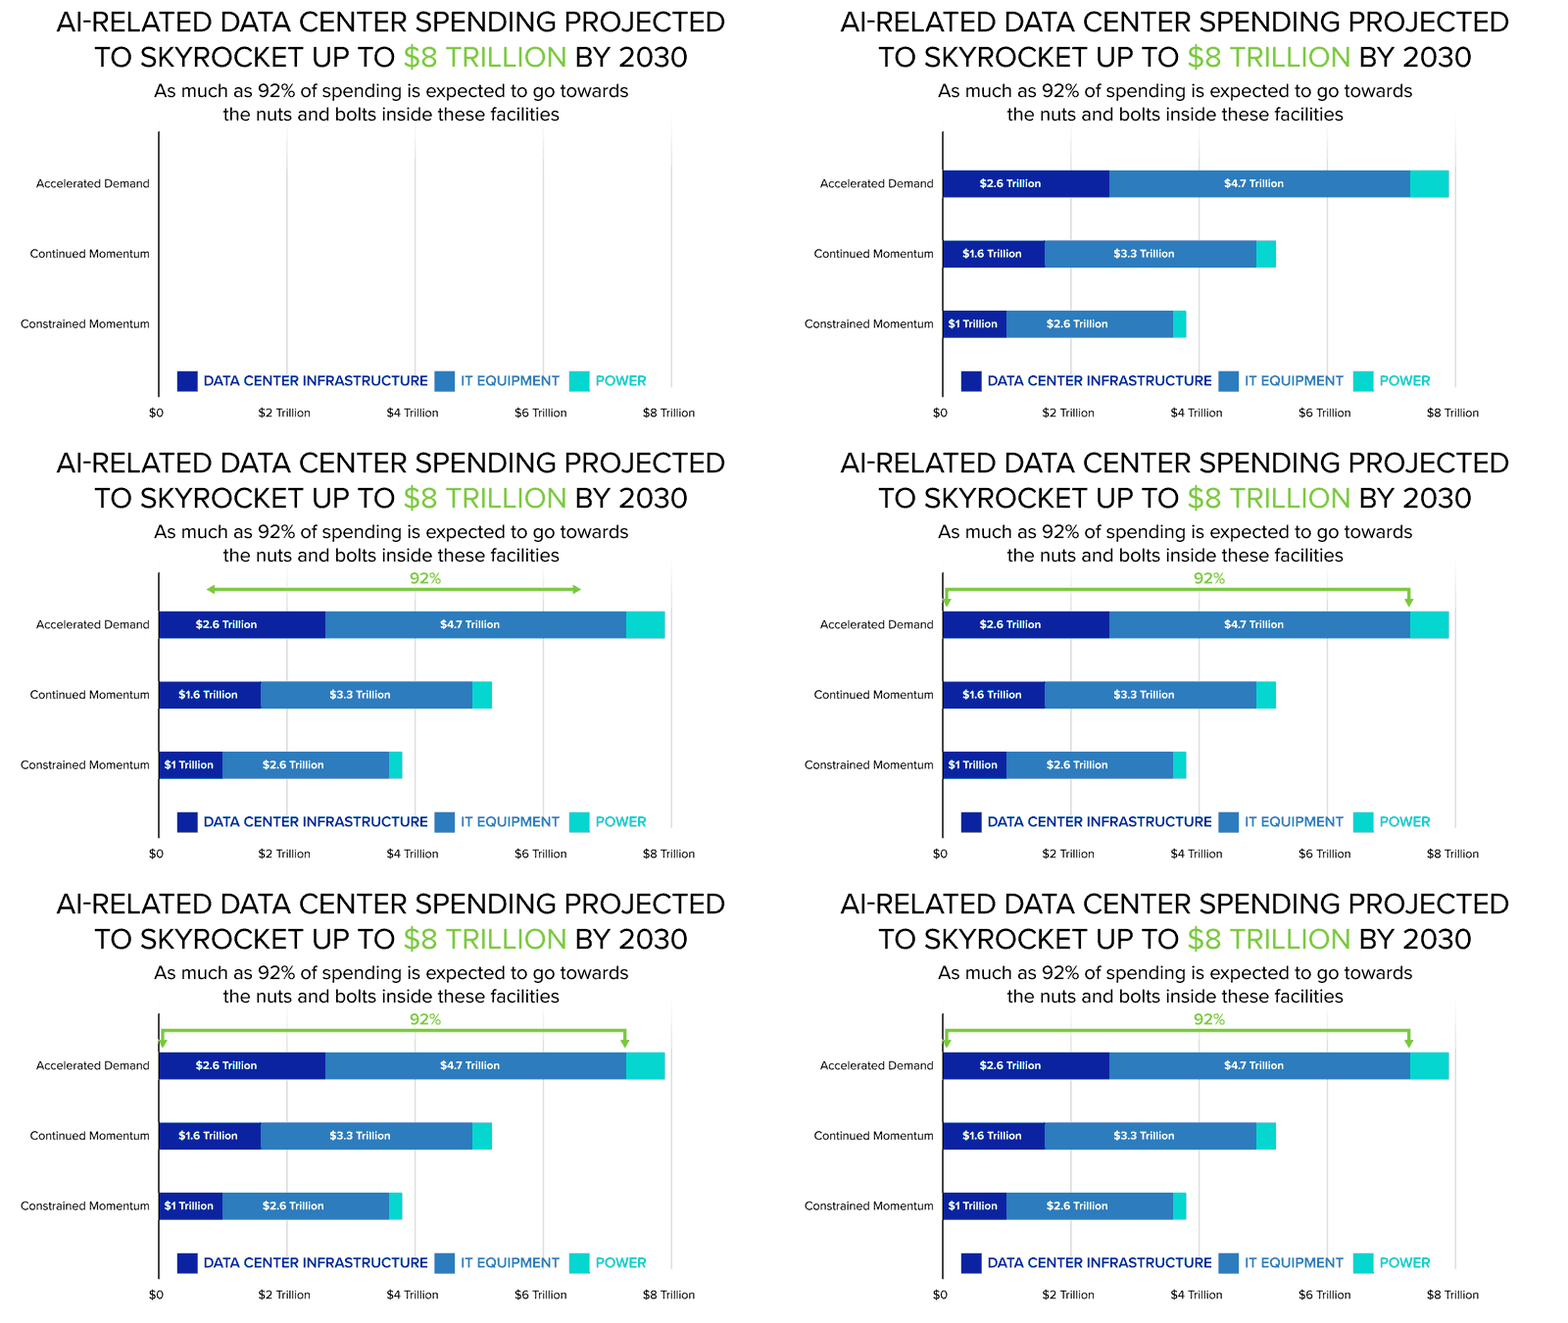
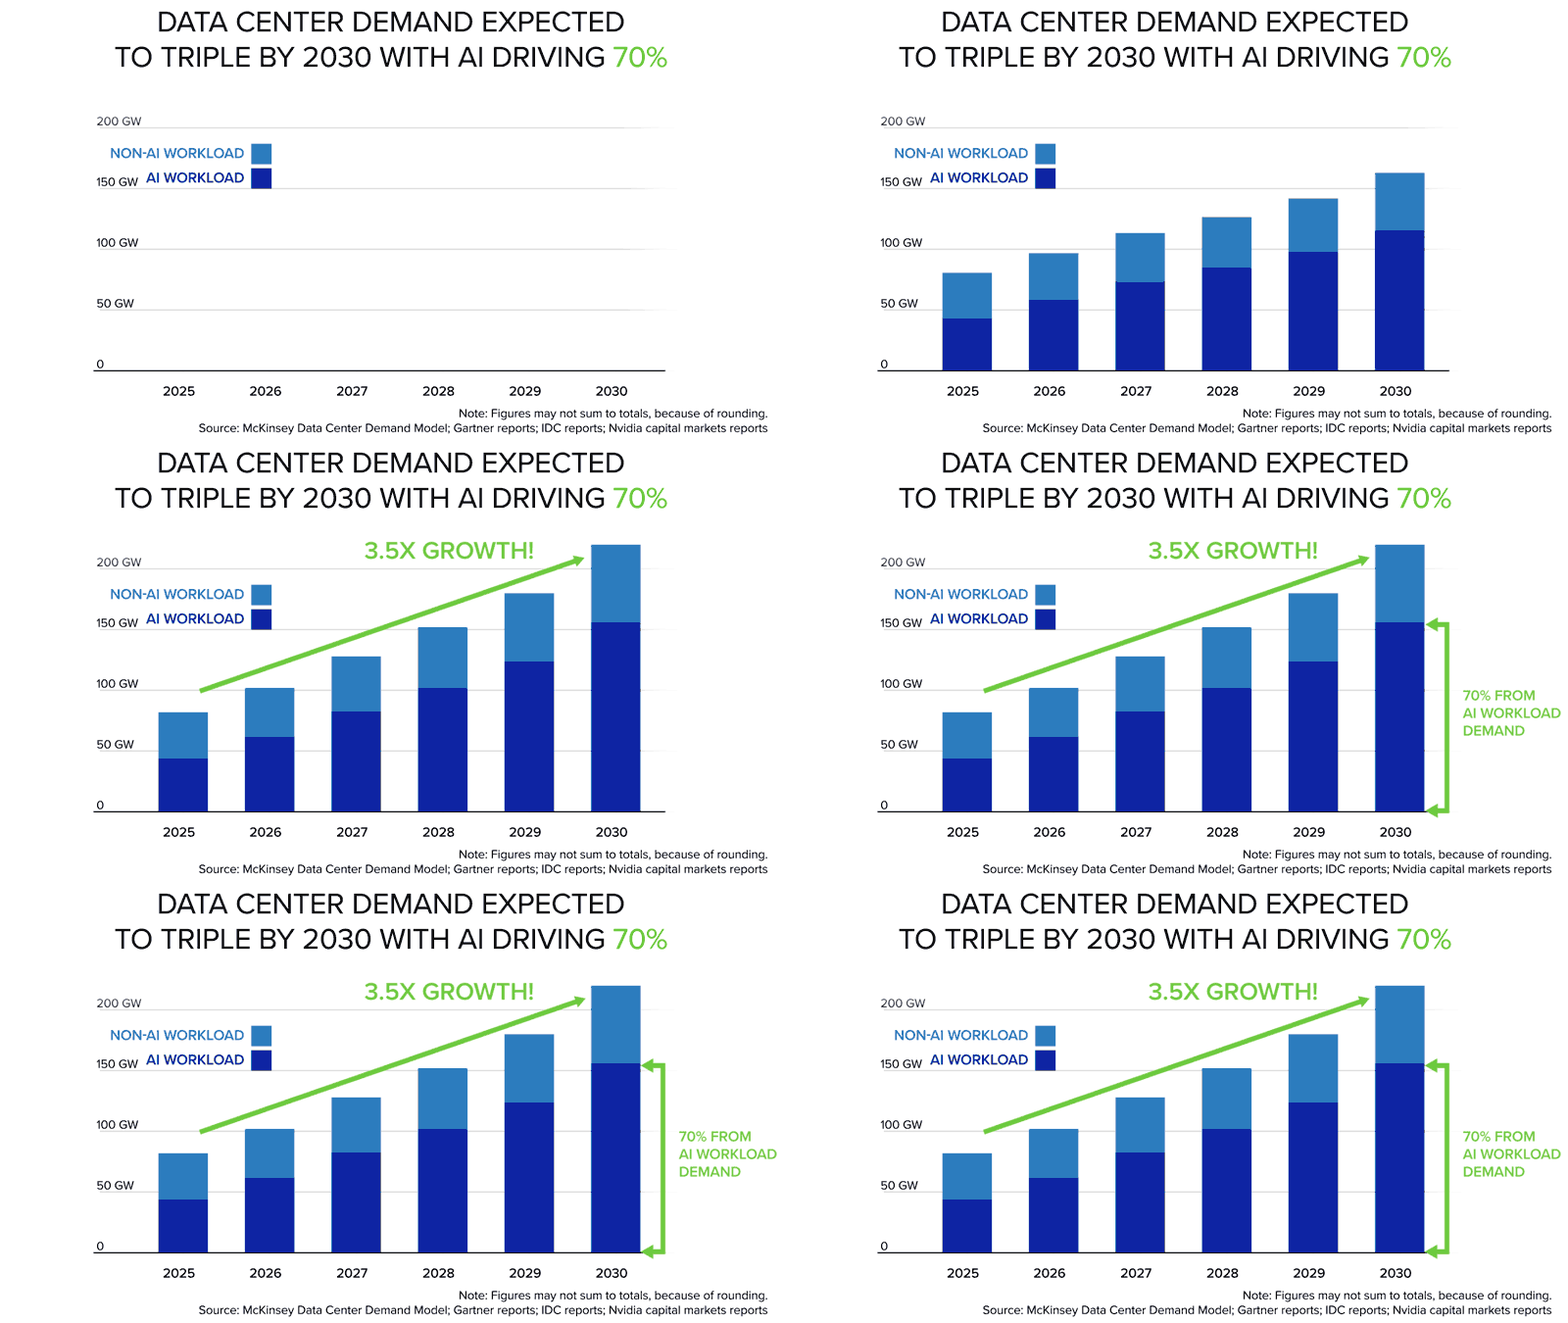
Built-In Motion: Animated annotations and transitions to bring charts to life.
Execution
Automated Templates: Reduced manual keyframing with javascript driven templates.
Cross-Platform Outputs: Video animations, web graphics, and lightweight GIFs for email.
Design Consistency: A unified, branded chart style carried across channels.
Workflow Training: Documentation and team training ensured adoption across the multimedia team.
Before
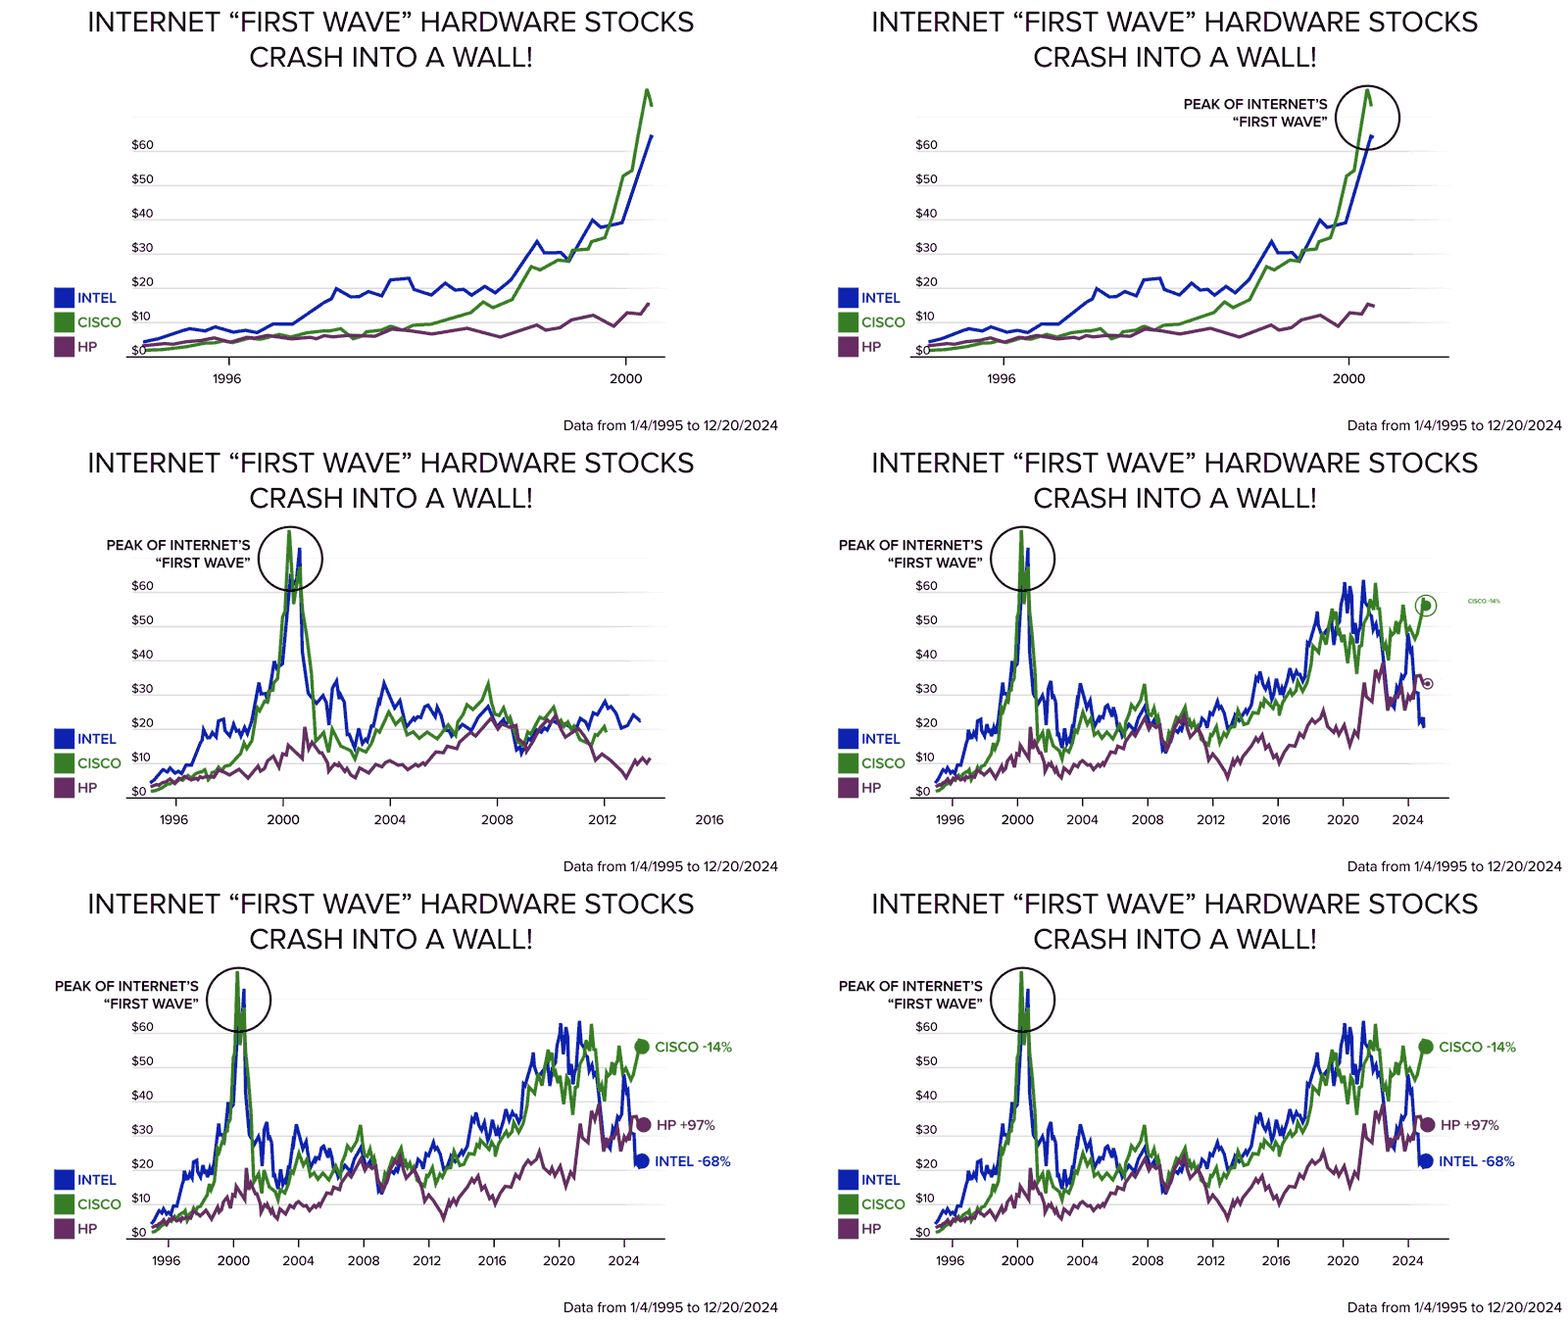
Static screenshots pasted from Google Sheets. Animated charts were rare, often taking up to a week to produce.
After
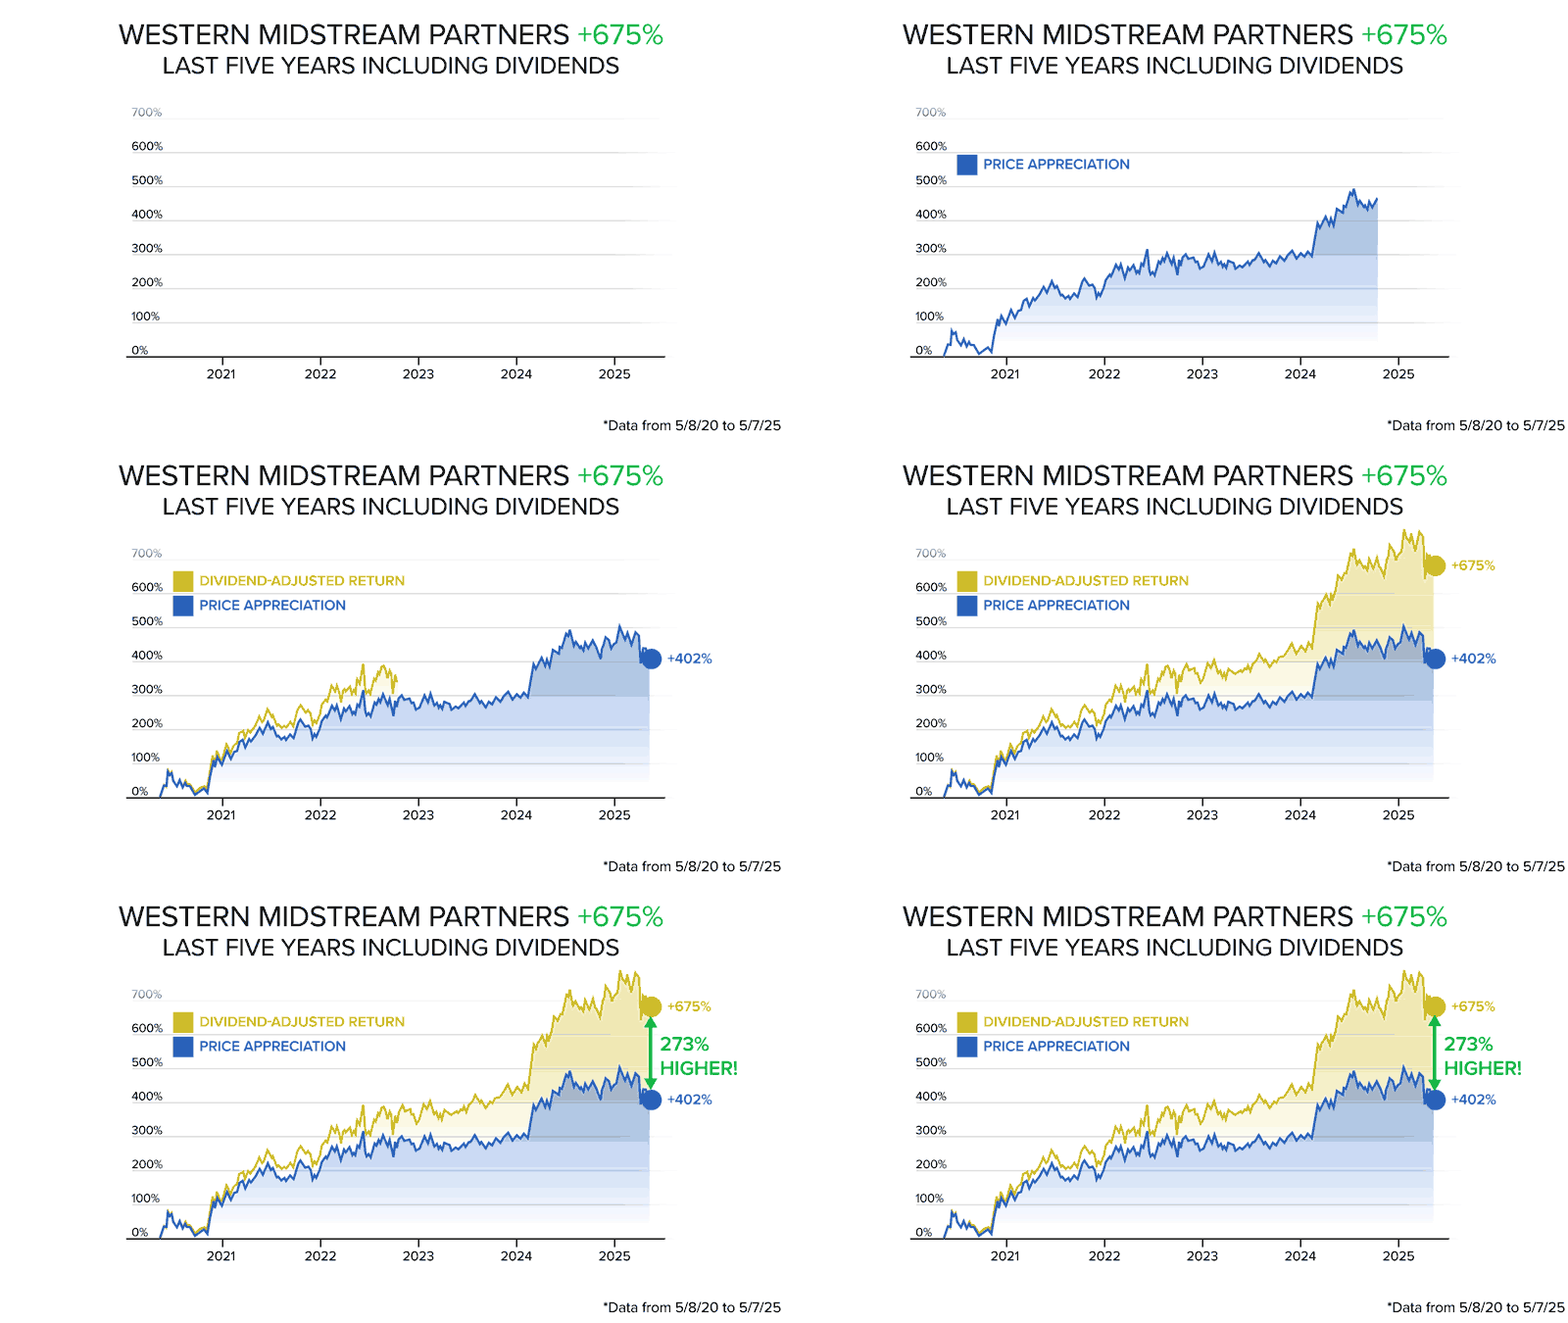
Automated, data-driven charts with instant styling adjustments.
Adaptable for video, web, and email. Built once, scaled infinitely.
Results
40x increase in chart output
Error reduction through centralized data inputs
Hundreds of charts produced without bottlenecks
Company standard established for branded charts
My Impact
Invented a System: Built a workflow others hadn’t replicated, merging creative design with automation.
Raised the Bar: Transformed financial charts from a pain point into a creative asset.
Enabled Growth: Freed creative teams to focus on higher-value work while scaling chart production.

